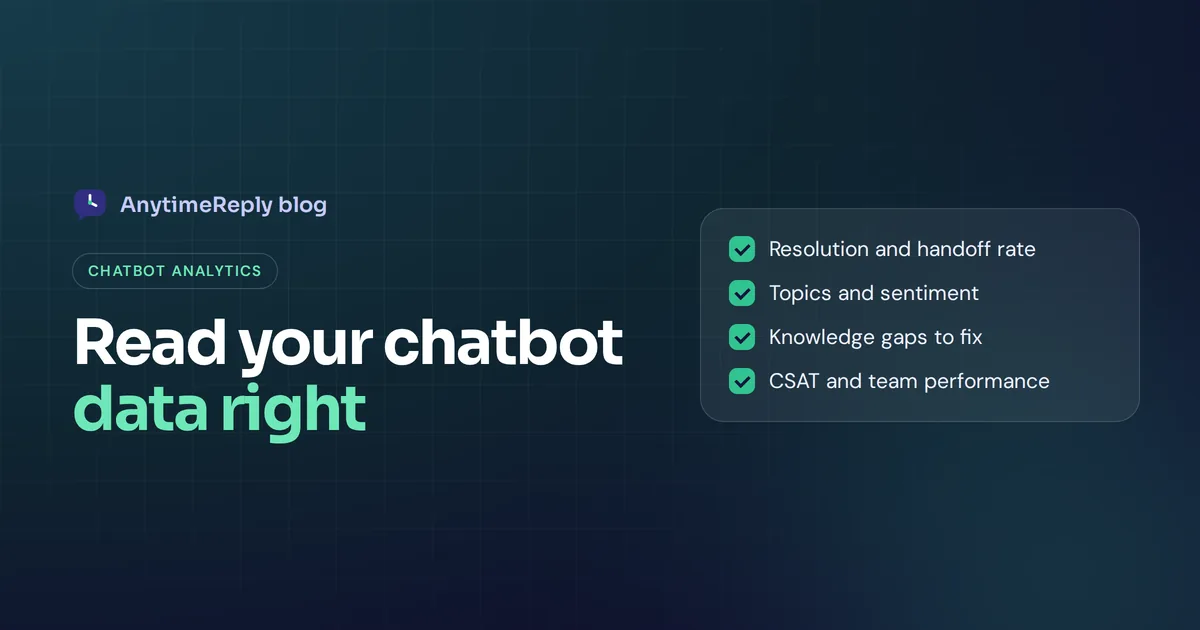
You set up a chatbot, it went live, and now it talks to customers all day. But is it actually helping? Is it answering the right questions, or quietly sending people away annoyed? Without chatbot analytics, you are guessing.
Chatbot data fixes that. It turns thousands of messages into a few clear numbers and patterns: what customers ask, how often the bot solves it, where it fails and how people feel afterwards. Done well, it shows you exactly what to fix next week.
This guide covers the metrics that matter, how to read a dashboard, how to measure ROI, the tools you can use and a simple weekly routine. We build an AI customer support chatbot, so we look at these numbers every day. We'll keep it practical.
What is chatbot analytics?
Chatbot analytics is the practice of collecting and studying data from your bot's conversations to understand how well it performs and what your customers need. It covers two kinds of data:
- Numbers about user interactions. How many conversations, how many messages, how many unique users came back, how many conversations ended with a handoff to a person.
- What is inside the conversations. The topics people ask about, the words they use, their mood, and the questions the bot could not answer.
Old rule-based bots mostly reported the first kind: clicks, sessions and button paths. An AI chatbot understands natural language, so you can also study the second kind. That is where most of the valuable insights live.
Why it matters: user engagement and business impact
A chatbot is never "done". Your products change, your prices change, and customers find new ways to ask the same question. Tracking performance is the feedback loop that keeps the bot useful and ties it to real business goals.
Here is what good data helps you do:
- Find knowledge gaps. Every "I'm not sure about that" is a missing answer. Add it once and the bot handles it forever.
- Prove value. If the chatbot resolves 300 order-status questions a month, that is 300 conversations your team didn't have to type. That is the number your boss or your accountant wants.
- Spot problems early. A sudden jump in "where is my order" messages often means a shipping delay, not a chatbot problem.
- Improve customer experience. Sentiment and ratings show where people get frustrated, so you can fix the flow or escalate to a person sooner.
- Learn what customers want. Conversation logs are free market research. Customers tell you, in their own words, what confuses them and what they wish you sold.
Key chatbot metrics and KPIs: the metrics to track
There are dozens of possible measurements. You don't need all of them. These are the metrics like resolution, ratings and conversion that we think matter most, grouped by the question they answer.
| Metric | What it tells you | How to measure it |
|---|---|---|
| Conversation volume | How much the bot is used | Number of conversations per day, week or month |
| Active and unique users | How many different people interact with the chatbot | Unique customers who sent a message in that period |
| Resolution rate | How often the bot solves the problem on its own | Conversations closed without human intervention, divided by all conversations |
| Escalation (handoff) rate | How often a person had to step in | Conversations handed to the team, divided by all conversations |
| Fallback rate | How often the chatbot cannot understand or answer | Unanswered or low-confidence replies, divided by all replies |
| Bounce rate | How many people leave after the first bot message | Conversations with only one customer message, divided by all conversations |
| Customer satisfaction (CSAT) | How customers rate the help | Ratings or thumbs up/down after a conversation |
| Sentiment | How customers feel during the conversation | AI labels each one positive, neutral or negative |
| Goal completion and conversion | Whether conversations lead to the outcome you want | Leads captured, bookings made, orders placed |
| Response time | How fast customers get a reply | Time from customer message to first answer |
Customer engagement
Conversation volume, messages per conversation and active users show whether people are actually using the chatbot and how many users interacting with the chatbot come back. A rising volume is good, but only if resolution stays healthy. More conversations with more failures just means more annoyed people.
A high bounce rate deserves a closer look. It can mean the greeting is off-putting, the first answer missed the point, or people only wanted one quick fact. Read a few of those conversations to tell which.
Performance: the rate measures
Resolution, escalation and fallback rates tell you how good the bot is at its job. Each one measures how often a specific part of the chatbot experience works, and these are the numbers to improve week by week. A high fallback rate usually means missing content, not bad chatbot technology.
Don't chase a zero escalation rate in customer support. Some conversations should go to a human: refunds above a limit, angry customers, legal questions. A healthy rate is one where the right cases reach your team quickly, with context.
Customer satisfaction metrics
Ratings and sentiment tell you how the help felt, not only whether it happened. User satisfaction and accuracy go together: a bot can technically "resolve" a question with a wrong answer and the customer leaves irritated. Read the low-rated conversations. They teach you more than any chart.
Business metrics
Goal completion ties the bot to money: leads captured, demos booked, orders placed, tickets avoided. If your bot is meant to sell, conversion is the metric that decides whether it is worth it.
How AI chatbots change what you can measure
A rule-based bot follows buttons, so its reports are mostly funnels: how many people clicked step 1, step 2, step 3. A generative AI agent reads free text in any language, so the interesting data is in the words.
Good AI tools track a few things a simple counter can't:
- Groups conversations into topics automatically. You see "shipping times", "returns" and "sizing" as clusters, even when customers phrase things a hundred different ways.
- Labels sentiment. You can filter to negative conversations and see what went wrong.
- Tracks confidence. A good agent knows when it isn't sure. Low-confidence answers are a to-do list for your knowledge base, and over time you want fewer of them.
- Lets you ask a query in plain words. Instead of building a report, you type "What did customers complain about last week?" and get an answer from your own data.
- Works across languages. A customer who writes in Hindi and one who writes in English about the same issue land in the same topic.
This is where AI really helps with data analytics. Reading 2,000 chat transcripts by hand is not realistic. Having the AI summarize them turns raw logs into actionable data.
What a good chatbot analytics dashboard looks like
A dashboard should answer three questions in under a minute: Is the chatbot busy? Is it doing a good job? What should I fix?
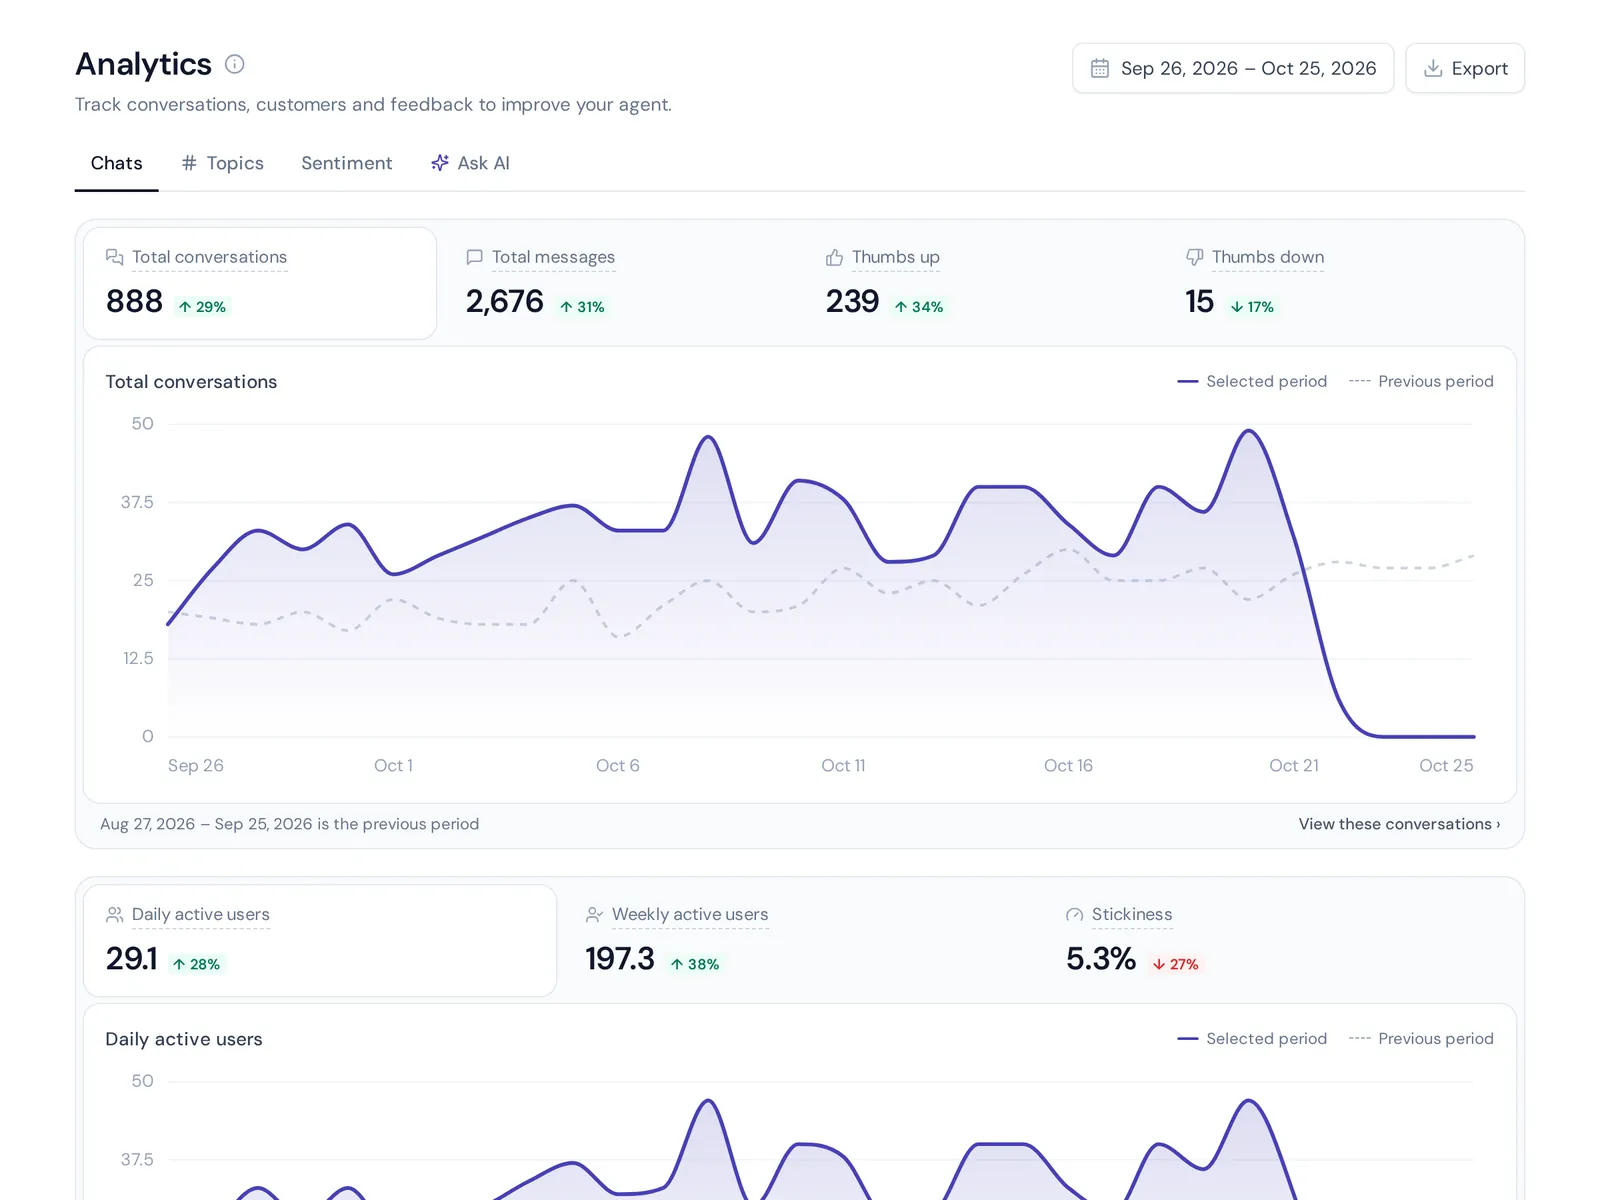
Look for a dashboard that tracks these parts of chatbot interactions:
- Top-line numbers. Total conversations, messages, ratings and active users for the period you choose.
- Trends over time. A chart that shows daily or weekly volume, so you can spot spikes after a campaign or a problem.
- Breakdown by channel. Website chat, WhatsApp, Instagram and email often behave very differently. Mixing them hides the story.
- Topics and sentiment. What people talk about and how they feel.
- Unanswered questions. The single most useful list on the whole page.
- Team performance. If humans handle handoffs, you want to see how fast they reply and how customers rate them.
If your analytics dashboard only shows a total count, it is a vanity report. Volume alone tells you nothing about quality.
How to measure chatbot ROI and business growth
Chatbot ROI is the value your assistant creates compared with what it costs. You don't need a finance degree. A rough, honest estimate is enough to make decisions.
- Count the conversations the chatbot handles alone. Your dashboard shows this.
- Estimate hours saved. Multiply those conversations by the average minutes a person would spend on each one.
- Turn time into money. Multiply that time by your team's hourly cost. That is your saving on support costs.
- Add revenue the chatbot helps create. Leads captured, bookings and orders where the bot played a part.
- Subtract what it costs. Subscription, AI usage and the time you spend maintaining it.
An example: say your assistant fully handles 400 conversations a month, and each would take your team 5 minutes. That is about 33 hours of work. At a team cost of $10 an hour, that is roughly $330 a month, before counting any sales it helps close. Use your own numbers, but this kind of measurable business value is what makes the case for spending more on it.
How to use your chatbot data: a weekly routine to optimize chatbot answers
You don't need a data team. Thirty minutes of weekly reviews is enough for most small businesses. Here is the routine we suggest:
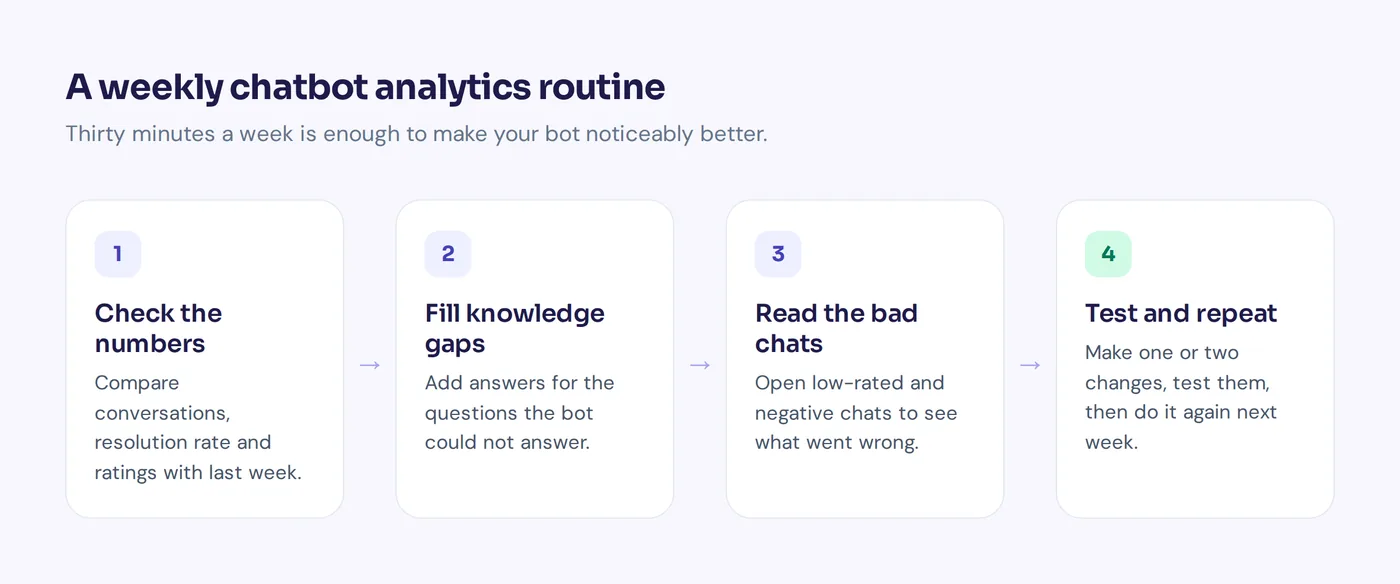
- Check the top numbers. Compare this week's conversations, resolution and ratings with last week. Note anything that moved a lot.
- Open the unanswered questions list. Look at every case where the chatbot fails, and add answers for the questions that came up more than once. Write them as short Q&A entries, the way you would reply on WhatsApp.
- Read five to ten low-rated or negative conversations. Ask: was the answer wrong, missing, too slow, or should this have gone to a person sooner?
- Look at the top topics. If one topic grew fast, find out why. A shipping delay, a confusing product page or a broken discount code often shows up here first.
- Make one or two changes. Update the knowledge, adjust a handoff rule or rewrite the greeting. Small, regular changes optimize the bot better than a big rebuild.
- Test before you move on. Ask the chatbot the questions you just fixed and check for accurate responses.
Then do it again next week. After a month, every chatbot usually feels noticeably smarter, simply because it has fewer gaps. There is no better way to use your chatbot data.
Choosing a chatbot platform: analytics tools compared
There are three main ways to get the data. Most businesses use the first one and add the second later. Each analytics chatbot setup has trade-offs.
1. Built-in reports in your support software
Most chatbots and helpdesk platforms, such as Intercom, Zendesk, Tidio and AnytimeReply, come with their own reports. This is the easiest place to start because the data is already there: conversations, ratings, handoffs, topics. The depth varies a lot between tools, so check what a chatbot analytics platform provides before you choose. Even the top chatbot tools differ here.
2. Web and product analytics tools
Tools like Google Analytics, Mixpanel or Amplitude track what visitors do on your site. You can send chat events (widget opened, lead captured, booking made) into them and see how the chatbot affects sign-ups or sales. They don't read the conversations, though. Use them to connect the assistant to business outcomes, not to improve answers. To use chatbot analytics for better answers, you need conversation-level data.
3. Exports and BI dashboards
Bigger teams sometimes export conversation data into a spreadsheet or a BI tool like Looker Studio to combine it with sales and CRM business data for deeper data analysis. It is flexible, but slow to build. For most small teams it is overkill.
What to look for when you compare tools
- Topics and sentiment, not just counts
- A list of unanswered or low-confidence questions with an easy way to add an answer
- Filters by channel, date and team member
- Ratings (CSAT) tied to the actual conversation
- A way to ask questions about your data without building reports
- Export or API access if you want the data elsewhere
Performance metrics mistakes that hurt chatbot efficiency
- Celebrating volume. More conversations isn't a win by itself. Check resolution and ratings next to it.
- Treating every handoff as a failure. Some cases belong with a person. Measure whether they reached the right person fast, not only how many there were.
- Never reading actual transcripts. Charts tell you where to look. The transcripts tell you what to fix.
- Counting spam. Junk conversations inflate your numbers and make the bot look worse. Filter them out.
- Changing ten things at once. If you change everything, you won't know what helped. Make small changes and compare.
- Looking once and forgetting. The data only pays off as a habit.
How AnytimeReply helps you track chatbot performance and resolution rate
AnytimeReply is an AI support agent with a built-in helpdesk, and reporting is included on every plan, including Free. Here is what you get:
- Ask your conversations a question in plain words, like "Why did people ask for refunds this month?"
- Topics, sentiment, countries and channels for every conversation, across website, WhatsApp, Messenger, Instagram, Telegram, email and Slack.
- Daily, weekly and monthly active customers to see real chatbot usage over time.
- Knowledge gaps: questions the agent couldn't answer, each with a one-click "Add answer".
- Ratings (CSAT) and team performance: a rating measures customer happiness for the conversations your people handle.
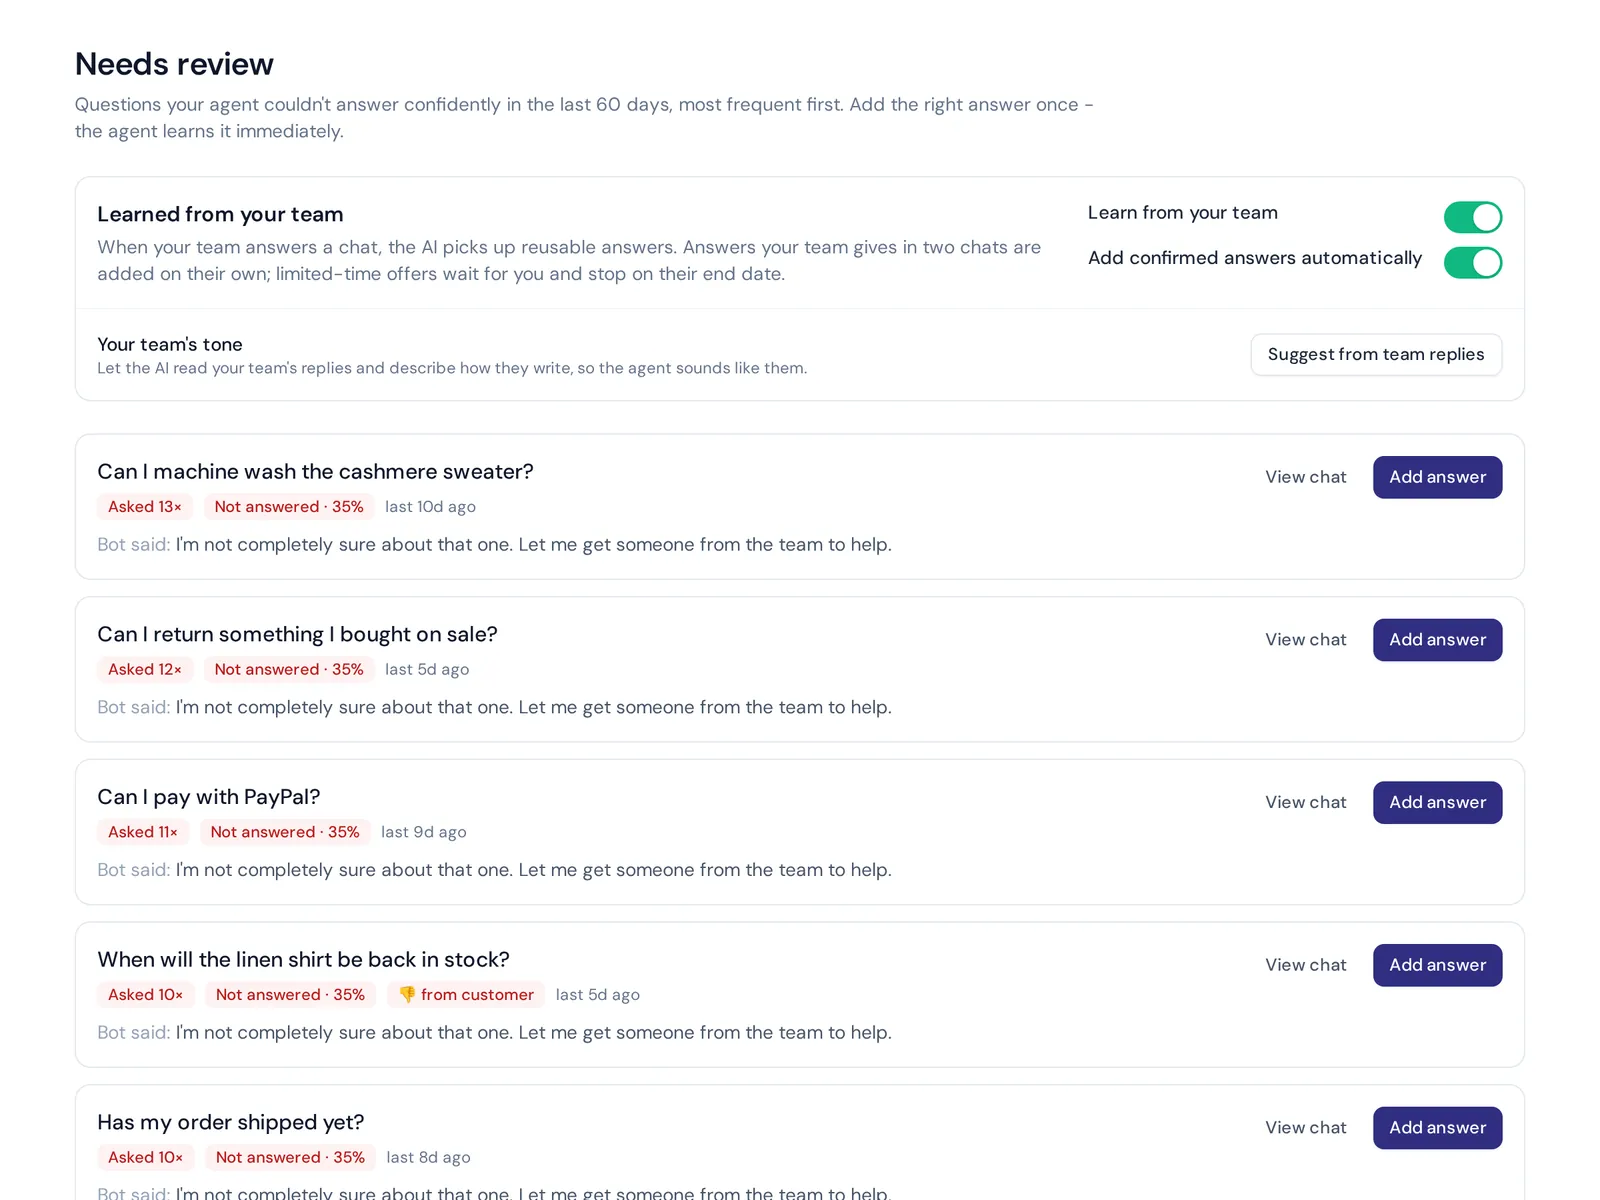
Every answer the chatbot responds with carries a confidence score, and when the agent doesn't know, it says so instead of guessing. Those moments land in the knowledge gaps list, so fixing them takes seconds. Tests and Copilot help with the next step: Copilot suggests fixes based on real conversations, you approve them, and plain-language tests check that nothing broke.
Honest limits: these reports are built for support and sales conversations. If you need a full marketing attribution model or custom BI reports across many data sources, you will still want a dedicated tool next to it.
Frequently asked questions
What is the most important chatbot metric?
If you only track one, track the resolution rate together with customer ratings. Resolution shows whether the chatbot solves problems. Ratings show whether customers were happy with how it solved them.
How do you measure chatbot success?
Start with the goal the bot was set up for. A support bot is judged by resolution, fallback and ratings. This is the core of customer support reporting. A sales bot is judged by leads captured, bookings and conversion. Compare the numbers month over month rather than against someone else's benchmark.
What is a good resolution rate?
There is no universal number. It depends on your business and how complex your questions are. A shop with lots of order-status questions can resolve far more than a company with complicated technical cases. What matters is that your own rate goes up as you fill knowledge gaps.
Can I integrate chatbot data with Google Analytics?
Partly. You can send events to Google Analytics to see how interactions with the chatbot affect conversions. But it can't read conversations, find topics or spot unanswered questions. You still need the reports inside your support tool for that.
How often should I review the numbers?
Once a week is a good rhythm for most teams. Check daily during launches, sales or big changes, when problems show up fast.
Can I monitor chatbot performance across different platforms?
Yes, if your tool brings every channel into one place. Look for a breakdown by channel so you can compare website, WhatsApp and Instagram side by side instead of checking each app separately.
Final thoughts
Good data isn't about fancy charts. It is a short weekly habit: check the numbers, fill the gaps, read the bad conversations and make one or two improvements. Do that for a month and your chatbot gets better on its own data.
Want to see your own data like this, right next to your live chat inbox? Start free with AnytimeReply, no card needed, and reporting is included from day one.
Published 4 November 2026 by AnytimeReply team