Your help desk is busy. Tickets come in, agents reply, customers say thanks (or don't). But is support actually getting better? Without numbers, you're guessing.
Help desk metrics are the numbers that show how fast, how well and how efficiently your support team works. The trick isn't tracking everything. It's tracking the right metrics, the handful that actually change your decisions.
In this guide you'll learn the common help desk metrics to measure support performance, how to calculate each one, how metrics differ from KPIs, the mistakes that make dashboards lie, and a simple weekly routine to turn numbers into better support. It works for customer support teams and IT service desks alike.
What are help desk metrics?
Help desk metrics are quantifiable measurements of your support operation: how many tickets you get, how quickly you respond, how many problems you solve, what it costs and how customers feel about it. Each help desk metric answers one question about your team.
They apply to any support setup, whether it's an IT help desk helping employees, a service desk inside a bigger IT service management (ITSM) process, or a customer service team answering emails, live chat and WhatsApp messages. The numbers are similar, only the customers differ.
Good metrics help you understand practical things:
- Do we need to hire another support agent, or fix our process?
- Which product or service creates the most tickets?
- Are customers happy with the help they get?
- Is our new chatbot or self-service content actually reducing workload?
Metrics like these help you spot problems early and show how well your help desk is really doing.
Help desk metrics and KPIs: what's the difference?
People use the words together, but they're not the same thing.
- A metric is any number you measure, like ticket volume or average handle time.
- A KPI (key performance indicator) is a metric you've picked as a main goal, with a target attached. For example: "First response time on live chat under 2 minutes."
So all KPIs are metrics, but not every help desk metric is a KPI. Think of KPIs and metrics as a pyramid: lots of numbers at the bottom, a few metrics that matter at the top. Most help desks track 15 or 20 metrics in the background and choose 4 to 6 KPIs that align with business goals. For an IT team, a service desk KPI could be "resolve priority 1 incidents within 4 hours". Pick KPIs that align with what the company cares about this year, whether that's customer retention, lower costs or faster growth.
Benefits of tracking help desk metrics
Support is easy to judge by feel. A busy day feels bad, a quiet day feels good. But feelings miss patterns. Maybe response times slip every Monday morning. Maybe one product causes a third of your tickets. Maybe one agent closes tickets fast but customers keep coming back.
Here's why these metrics matter in practice:
- Better quality of service, because you find where customers wait or get stuck.
- Smarter staffing, based on real workload, not guesses.
- Early warnings, like a broken checkout page creating a wave of chats.
- Fair coaching for your help desk team, with facts instead of opinions.
- Proof of value, so you can show the rest of the business what support delivers.
The 4 types of help desk performance metrics
It helps to group your set of metrics so you don't over-focus on one area:
| Type | What it measures | Examples |
|---|---|---|
| Productivity | Workload and flow | Ticket volume, backlog, tickets resolved |
| Speed | How long customers wait | First response time, resolution time, SLA compliance |
| Quality and customer impact | Whether customers got real help | CSAT, first contact resolution, reopen rate, CES |
| Cost and efficiency | What support costs | Cost per ticket, agent utilization, automation rate |
14 help desk metrics to track
Here are the key help desk metrics most teams rely on, with simple formulas. You don't have to use all of them. Track the right ones for your team, because a small online shop and a large IT department need to track very different things.
1. Ticket volume
The number of support tickets opened in a period. It's the base for almost everything else and the key metric for staffing. Track the number of tickets by channel, topic and time of day to see where demand comes from. Keeping track of ticket volume also helps you spot spikes after a release or outage.
2. First response time (FRT)
How long a customer waits for the first real reply. This is the desk metric customers feel most.
Formula: total time to first response ÷ number of tickets.
Expectations depend on the channel. Live chat customers expect seconds or minutes. On email, a few hours is often fine. Track it per channel, not as one blended number.
3. Average resolution time
How long it takes to fully solve a ticket, from open to resolved. Some teams call it time to resolution.
Formula: total resolution time ÷ number of resolved tickets.
Long resolution times often point to missing knowledge, too many handoffs, or waiting on another department.
4. First contact resolution (FCR)
The share of tickets solved in the first interaction, with no follow-up. High FCR usually means happy customers and an efficient team. IT teams on the phone often call it first call resolution.
Formula: tickets resolved on first contact ÷ total tickets × 100.
5. Customer satisfaction score (CSAT)
How satisfied customers are after an interaction, usually from a quick survey: a 1 to 5 scale or thumbs up/down.
Formula: positive ratings ÷ total ratings × 100.
CSAT is the simplest view of service quality. Read the comments too. A low score often explains itself in one sentence.
6. Ticket backlog
The number of open tickets not yet resolved. A growing ticket backlog means demand is higher than capacity, or something is stuck.
7. Reopen rate
The percentage of resolved tickets that customers reopen because the problem wasn't really fixed. A high number means agents close too fast.
Formula: reopened tickets ÷ resolved tickets × 100.
8. Cost per ticket
What it costs, on average, to handle one ticket.
Formula: total support costs (salaries, tools, overhead) for a period ÷ tickets handled in that period.
Say your support costs $6,000 a month and you handle 1,500 tickets. Your cost per ticket is $4. This is the metric finance teams care about, and the one that shows the value of automation most clearly.
9. Average handle time (AHT)
How much active time an agent spends on a ticket, including replies and after-work like notes. Useful for staffing, but don't push it down at the cost of quality.
10. Agent utilization and agent performance
How much of an agent's time goes to handling tickets, plus tickets resolved per agent, CSAT per agent and reopen rate per agent. Look at agent performance as a group of numbers, never just one.
11. SLA compliance
If you promise response or resolution times in a service level agreement, this shows how often you meet them.
Formula: tickets that met the SLA ÷ total tickets × 100.
12. Escalation rate
How often tickets go to a senior agent, another team, or from an AI to a human. High escalation can mean your first line lacks training, tools or permission.
13. Self-service and automation rate
The share of questions answered without an agent, by help center articles or an AI agent. It shows how much of your workload is truly repetitive.
14. Customer Effort Score (CES) and NPS
CES asks how easy it was to get help. NPS asks how likely customers are to recommend you. CES is closer to support and very useful. NPS reflects the whole relationship, so treat it as context.
Service desk KPIs and performance metrics for IT teams
If you run an IT service desk, most of the list above applies. Good KPIs for service desks give extra weight to a few service desk performance metrics. Some service desk KPI examples:
- Mean time to resolve (MTTR) for incidents.
- SLA compliance by priority level. Track your service desk by priority, not as one big average.
- Incident volume vs service request volume, to separate "something broke" from "I need something".
- Average speed to answer on phone lines.
- Change success rate, if the service desk team is involved in changes.
To measure the success of a service desk, ask one simple question for each service desk metric: "How does this show business value?" If a number doesn't help someone make a decision, it's probably one of those vanity metrics that look good in a report and change nothing. Choosing the right service desk KPIs means picking the ones that connect to uptime, employee productivity and cost. Those metrics show leadership whether IT support helps the business, which is the real measure of help desk success.
How to measure performance the right way
Numbers only help if they're honest. Good metric tracking starts with a few habits:
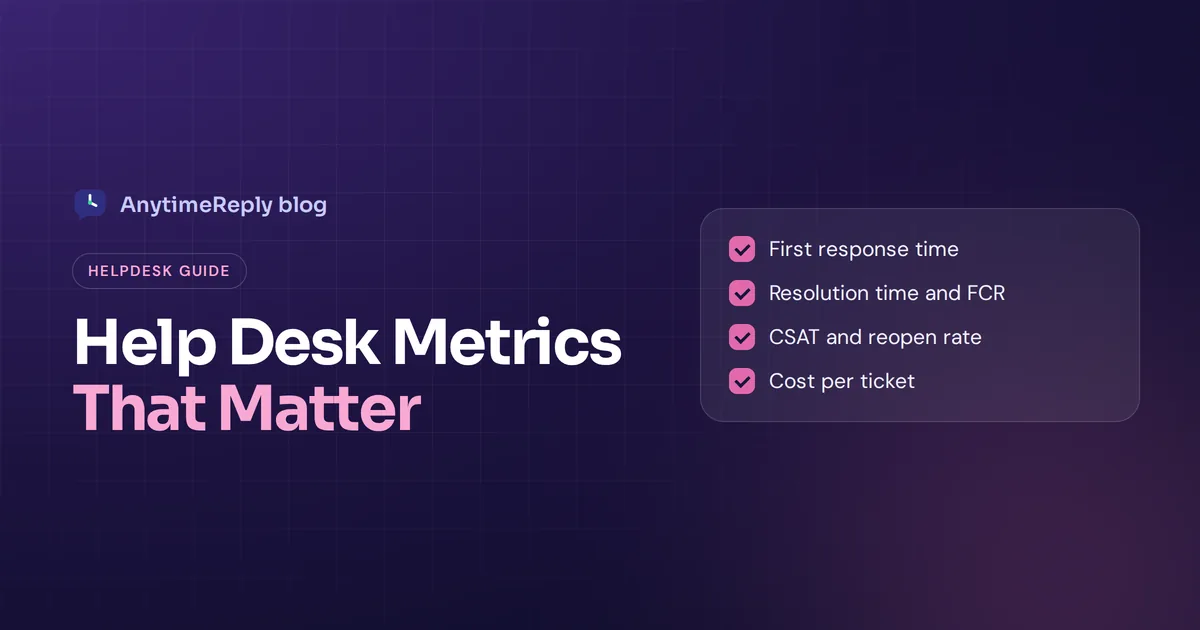
- Pick 4 to 6 core KPIs, metrics that align with your goals. Most help desks do well with a starter set: ticket volume, first response time, resolution time, CSAT, backlog and reopen rate.
- Use medians as well as averages. One ticket that took 9 days can make your average look awful while most customers were helped in an hour.
- Split by channel and topic. Chat, email and WhatsApp have very different expectations, and "refunds" shouldn't share a target with "password reset".
- Look at trends, not single days. Track progress week over week and month over month.
- Pair speed with quality. Always read response time next to CSAT and reopen rate.
- Use a help desk tool that tracks it for you. Spreadsheets work at first, but help desk analytics built into your inbox saves hours.
Common mistakes that make your metrics lie
- Counting auto-replies as first responses. Many help desks do this. But "We got your email" is not help. Measure the first useful reply.
- Rewarding speed alone. If agents are judged only on tickets closed, they'll close tickets that aren't solved.
- Ignoring silent customers. Many unhappy customers never fill in a survey. Look at sentiment in conversations, not just ratings.
- Tracking too much. A dashboard with 30 numbers gets ignored. Before you add a help desk metric, ask what decision it will change. Focus on the metrics that drive action.
- Never asking "why?" A metric is a symptom. The fix is usually in content, process or product.
Improve your help desk with a weekly review
You don't need a data team. Thirty minutes a week works if you follow a routine:
- Check the trend. Volume, first response time, resolution time and CSAT compared with last week.
- Find the top 5 topics. What did customers ask about most?
- Read 10 conversations. Five rated badly, five at random. You'll learn more than any chart shows.
- List the unanswered questions. Write help articles or verified answers for them.
- Pick one improvement. One fixed article, one new routing rule, one new macro. Check next week if it worked.
How AI changes help desk metrics
For help desks that add an AI agent to answer first, some numbers shift, and that's expected:
- First response time drops to seconds for the conversations the AI handles.
- Agent ticket volume drops, but the tickets left are harder, so human resolution time may go up. That's normal, not a sign your team got slower.
- Cost per ticket falls, because repeat questions no longer need an agent.
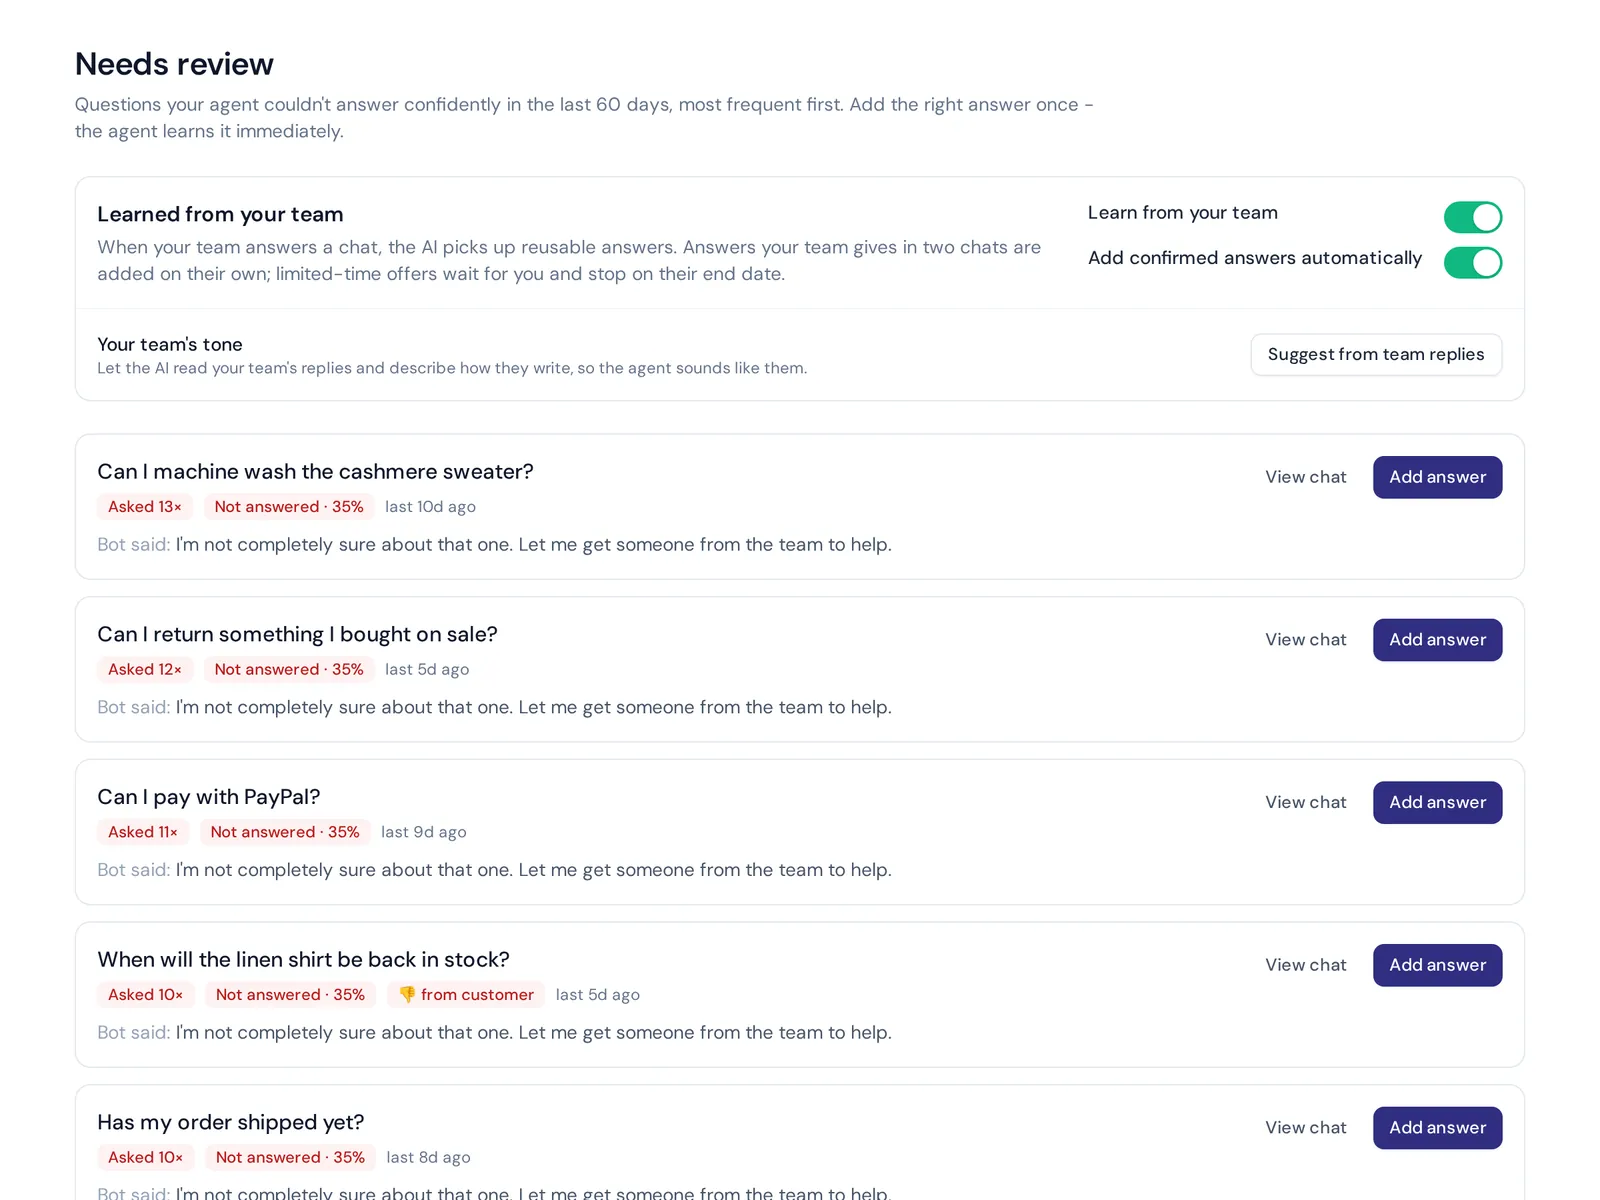
- New metrics appear: automation rate, handoff rate and knowledge gaps (questions the AI couldn't answer).
The honest warning: an AI that "resolves" chats by refusing to hand off will make your automation rate look great while customers get angry. Always track handoff requests and CSAT next to automation.
How AnytimeReply helps you track support performance
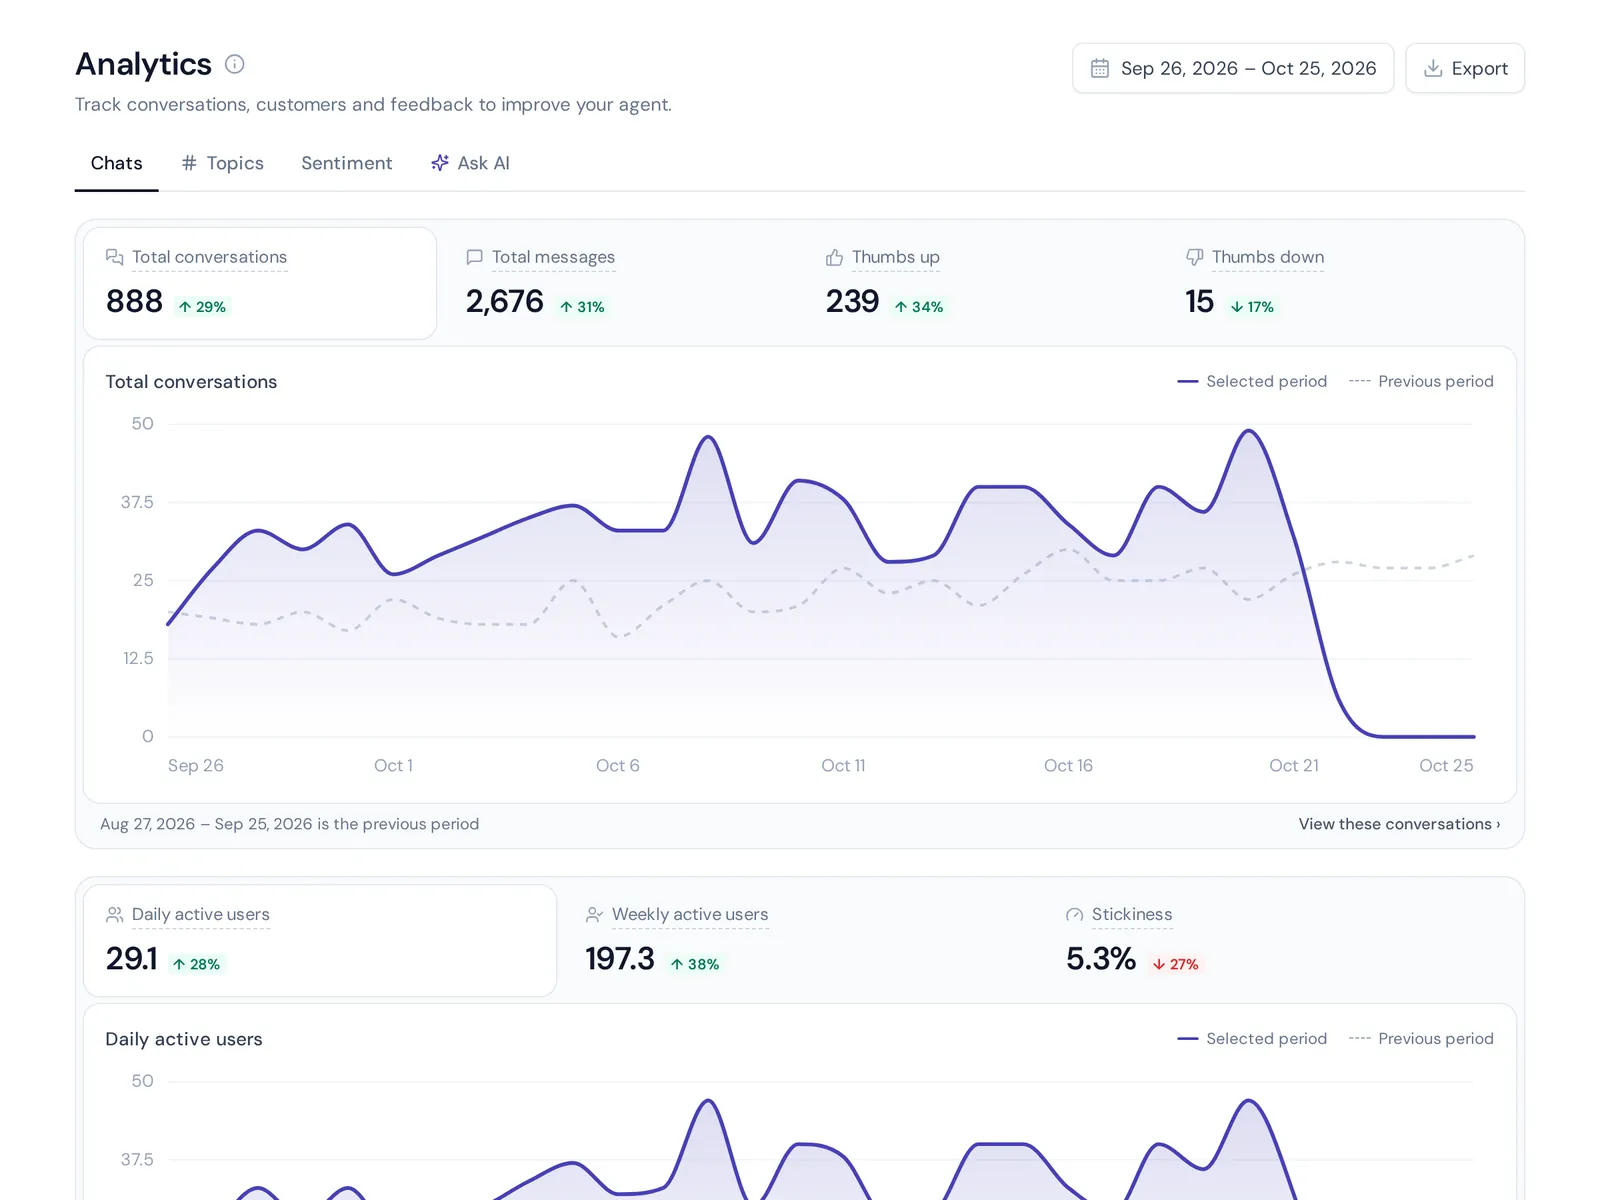
AnytimeReply is an AI agent with a built-in helpdesk, so the AI and your team work from one inbox and the numbers live in one place. In analytics you can:
- See conversations and daily, weekly or monthly active customers, plus channels and countries.
- Track ratings (CSAT) and team performance.
- See topics and sentiment, so you know what customers ask and how they feel.
- Ask your conversations a question in plain words, like "why are people asking for refunds this week?"
- Find knowledge gaps and add an answer in one click.
Email works too: tickets from Gmail, Outlook or any mailbox get a status, priority and owner, and a customer reply reopens the ticket. Website chat, the helpdesk inbox and analytics are on the free plan.
To be fair about limits: if you need heavy ITSM reporting, like dozens of SLA reports for an enterprise IT service desk, a dedicated service management tool may suit you better.
Frequently asked questions
What are the 5 key performance indicators for customer service?
A common set is first response time, average resolution time, first contact resolution, customer satisfaction (CSAT) and ticket backlog. Add cost per ticket if budget is a big concern.
What are the 5 key CX metrics?
Customer experience teams usually look at CSAT, Net Promoter Score (NPS), Customer Effort Score (CES), churn or retention rate, and first contact resolution.
How do you measure help desk performance?
Combine speed (response and resolution time), quality (CSAT, reopen rate, FCR) and efficiency (cost per ticket, backlog). Review trends weekly and read real conversations next to the numbers.
What is a good first response time?
It depends on the channel. Live chat customers expect seconds to a few minutes, while email customers often accept a few hours. Set targets per channel and improve on your own baseline.
What are the top KPIs in BPO support?
Outsourced support teams typically track average handle time, first call resolution, SLA compliance, CSAT and quality assurance scores.
How often should I review help desk metrics?
Glance at key numbers daily if volume is high, do a short review every week, and a deeper review every month or quarter for staffing and planning.
Final thoughts
Help desk metrics aren't about pretty dashboards. Pick a few numbers that matter, read them next to real conversations, and change one thing every week. That's how support gets faster, customers get happier, and small help desks build a better help desk experience without a data team.
Want your AI and your team in one inbox, with the numbers built in? Start free with AnytimeReply. No card needed.
Published 2 November 2026 by AnytimeReply team